
NHTSA’s 2024 Motorcycle Data: 6,228 Riders Killed, Injuries Up 5%, and Florida Leads the Nation
NHTSA’s 2024 crash data shows motorcycle deaths slipping while injuries climbed, and Florida holding the deadliest riding distinction in the country, ahead of both Texas and California.
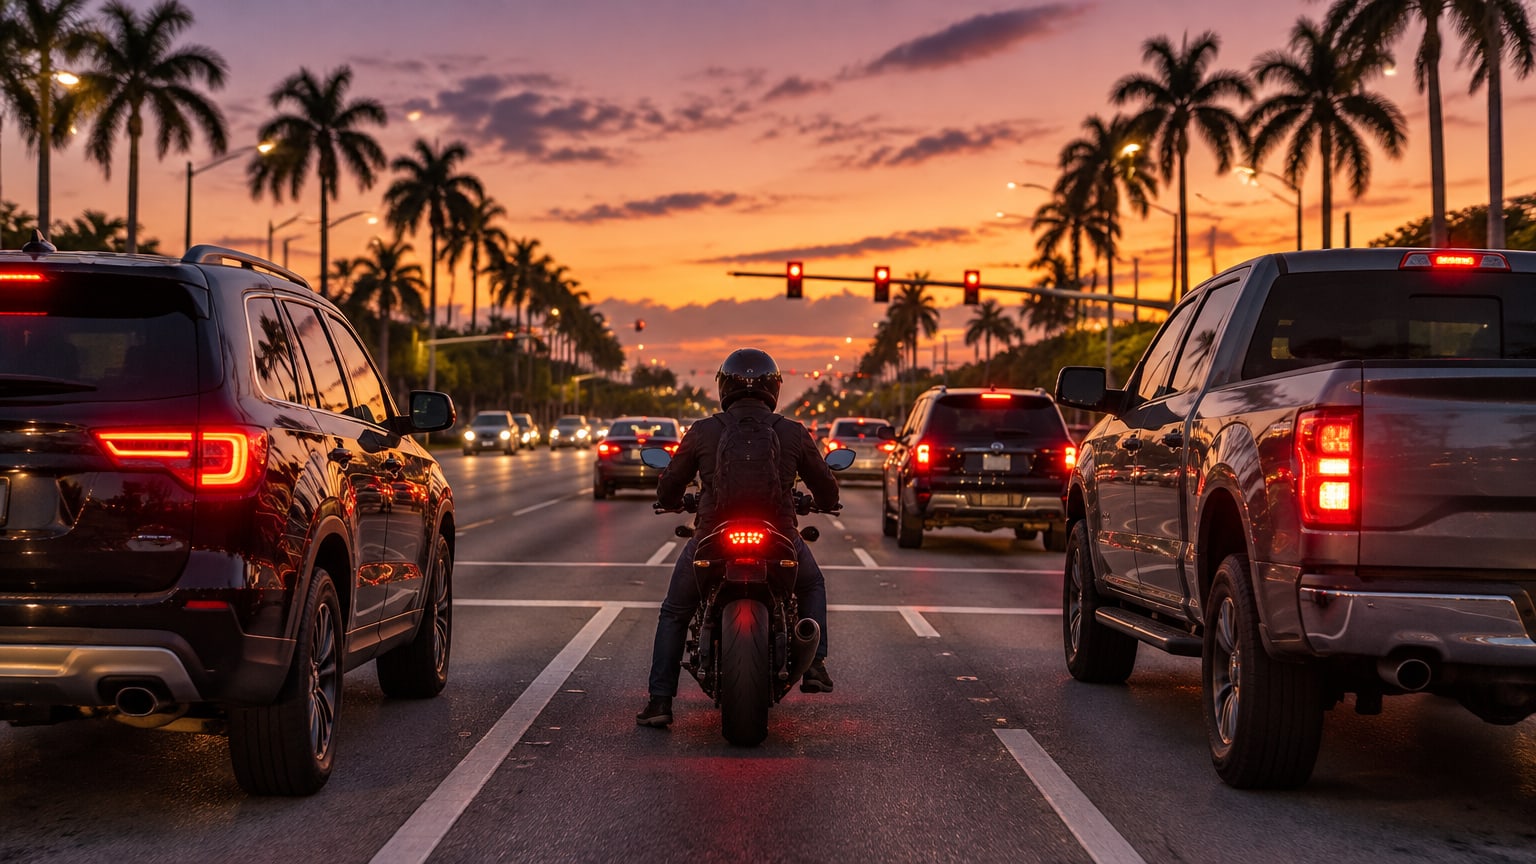
Every year, the federal government compiles every fatal traffic crash in the country into one database, and this spring it published the 2024 edition. For motorcyclists, the headline splits in two directions. Deaths fell: 6,228 riders and passengers were killed in 2024, down 2.2 percent from 6,366 the year before. Injuries rose: an estimated 86,887 motorcyclists were hurt, up 5.2 percent. And in the state rankings, Florida sat alone at the top with 642 deaths, more than Texas (583) or California (522), both of which have far larger populations.
But riders lost ground relative to everyone else on the road, and the state where riding is most lethal by sheer volume is Florida.
Three directions at once
Total traffic deaths in the United States fell 4.3 percent in 2024, from 41,025 to 39,254, the third straight annual decline. Motorcycle deaths fell too, but only 2.2 percent. That gap is why motorcyclists made up 16 percent of all traffic fatalities in 2024, up from about 15.5 percent in 2023, even though motorcycles account for roughly 3 percent of registered vehicles.
2024 moved in three different directions
Year-over-year change, 2023 to 2024
NHTSA does not explain the divergence in the report. More miles ridden, more new riders, and changes in crash reporting can all push injuries up while deaths drift down. The risk gap itself is not ambiguous. Per 100 million vehicle miles traveled in 2024, the motorcyclist fatality rate was 28.00. The passenger car occupant rate was 1.05. A rider was almost 27 times as likely to die per mile as a person in a car, and almost five times as likely to be injured.
| Measure | 2024 | 2023 | Change |
|---|---|---|---|
| Motorcyclists killed | 6,228 | 6,366 | −2.2% |
| Motorcyclists injured (estimate) | 86,887 | 82,567 | +5.2% |
| Share of all traffic fatalities | 16% | 15.5% | up |
| Rider fatality rate per 100M miles | 28.00 | 31.39 | down |
| Passenger car occupant rate per 100M miles | 1.05 | 1.13 | down |
| Observed DOT-compliant helmet use | 74% | n/a | n/a |
| Operators in fatal crashes without a valid motorcycle license | 35% | n/a | n/a |
Of the 6,228 killed, 96 percent were riders themselves (5,950) and 4 percent were passengers (278). It remains one of the highest annual totals recorded since FARS began in 1975, and it sits just under the all-time high of 6,366 set in 2023.
Fifty years of falling behind
The 2024 dip lands inside a five-decade trend that runs against riders. In 1975, motorcyclists were 7 percent of American traffic deaths: 3,189 of 44,525. By 2024 they were 16 percent. The number of riders killed nearly doubled over that span while passenger vehicle occupant deaths fell 26 percent, from 30,785 to 22,713, according to the Insurance Institute for Highway Safety’s analysis of the same FARS data.
Motorcyclist deaths, 1975 to 2024
Annual deaths of motorcycle riders and passengers, with the share of all traffic deaths marked
The mechanism behind that share shift is straightforward. Cars absorbed five decades of safety regulation: airbags mandated in 1998, electronic stability control in 2012, automatic emergency braking arriving with the FMVSS 127 rule due in 2029. Motorcycles absorbed almost none of it. No federal crash-avoidance or crashworthiness standard adopted since the 1970s applies to motorcycles. The clearest available counterexample is antilock brakes: an IIHS study covering 65 models found bikes with ABS had 22 percent fewer fatal crashes than identical models without it, and the European Union mandated motorcycle ABS in 2016. IIHS has petitioned NHTSA twice, in 2013 and 2023, to require the same in the United States. No rulemaking has followed.
The state ranking: Florida on top
When NHTSA’s 2024 FARS data reached the public, the state list told the clearest story at the very top. Florida recorded 642 motorcyclist deaths, Texas 583, California 522. The fourth-place state, Ohio, had 222. Florida alone accounted for more than 10 percent of every rider death in the country.
Where riders died in 2024
Ten states with the most motorcyclist deaths, FARS data via the National Safety Council
The popular assumption that California or Texas tops the list is several years out of date. Florida already led in 2018 (547 deaths) and 2019 (559), according to NHTSA’s state tables from that period, and led again in 2023 with 668, the state’s worst year on record. The new 2024 numbers show a small pullback in all three states, with California falling hardest, yet the order at the top held.
The top three, four data years
Motorcyclist deaths in Florida, Texas, and California
Florida
Texas
California
Two rankings, two different lessons
Raw death counts mostly reflect a state’s size and riding volume. Rank the same 2024 data by deaths per 100,000 residents and the map rearranges itself completely: Florida falls to seventh, and Wyoming, which recorded just 24 deaths, jumps to the top with 4.08 per 100,000, a rate 48 percent above Florida’s.
Same year, two rankings
Selected states ranked by total deaths versus deaths per 100,000 residents, 2024
| State | Deaths | Rank by total | Per 100K | Rank by rate |
|---|---|---|---|---|
| Florida | 642 | 1 | 2.75 | 7 |
| Texas | 583 | 2 | 1.86 | 30 |
| California | 522 | 3 | 1.32 | 44 |
| Wyoming | 24 | 45 | 4.08 | 1 |
| South Dakota | 33 | 42 | 3.57 | 2 |
| Montana | 38 | 38 | 3.34 | 3 |
| Arizona | 219 | 5 | 2.89 | 4 |
| South Carolina | 154 | 13 | 2.81 | 5 |
| Colorado | 165 | 12 | 2.77 | 6 |
| New York | 209 | 8 | 1.05 | 48 |
Florida’s 642 deaths are the number a state safety office plans around, while Wyoming’s rate is the better gauge of how exposed one rider is on their own roads.
Why Florida
Several structural conditions stack in Florida’s case, and the federal data points at most of them. The state’s partial helmet law lets riders over 21 skip a helmet if they carry $10,000 in medical insurance coverage, a loophole that leaves a large share of riders unprotected. Riding happens twelve months a year, which means more exposure per registered bike than in any northern state. The road network is built around high-speed urban arterials, the exact environment where car-motorcycle conflicts concentrate. And an older population means more riders, and more drivers, with slower reaction margins.
“Florida’s position at the top of this list isn’t an accident. It’s a product of our road design, our helmet laws, and how much riding happens here year-round,” Marc L. Shapiro of the Naples-based Law Offices of Marc L. Shapiro, P.A. said in a press release accompanying his firm’s analysis of the FARS data. His firm’s interest in the topic is commercial, but the numbers behind his analysis come from the National Safety Council’s read of the federal file.
The helmet question carries the most direct evidence. NHTSA’s 2024 report measured what happens under each type of law: in states without universal helmet laws, 48 percent of the motorcyclists killed were not wearing a helmet. In states with universal laws, the figure was 11 percent. CDC research puts helmet effectiveness at a 37 percent reduction in the risk of death and about 67 percent for brain injury. Only 17 states and the District of Columbia currently require helmets for all riders.
What the law does to helmet use in fatal crashes
Share of motorcyclists killed who were not wearing a helmet, 2024
of killed motorcyclists were unhelmeted.
of killed motorcyclists were unhelmeted. Helmets are about 37% effective in preventing deaths.
The riders in the file
The 2024 report also profiles the people on the bikes, and two findings stand out because they are things a rider controls directly.
Licensing. Thirty-five percent of the motorcycle operators involved in fatal crashes in 2024 did not hold a valid motorcycle license. More than one rider in three, in the worst crashes in the country, had never completed the written test, the skills test, or the rider course that the endorsement requires. In the fatality file, the endorsement stands in for a training record.
Alcohol and darkness. Riders killed at night were 2.6 times as likely to be alcohol-impaired as riders killed during the day: 37 percent versus 14 percent. Across all crashes, 40 percent of riders who died in single-vehicle crashes were impaired, and motorcycle riders tied passenger car drivers for the highest alcohol impairment rate of any vehicle type in fatal crashes, at 25 percent each.
Night riding changes the impairment picture
Share of killed motorcycle riders who were alcohol-impaired, 2024
of riders killed in daylight were alcohol-impaired.
of riders killed at night were alcohol-impaired, 2.6 times the daytime share.
Every state, ranked
The complete 2024 list, from the federal FARS data as compiled by the National Safety Council, with each state’s death rate per 100,000 residents. This is the number to check before you decide your roads are safe because your state is not on the news.
Motorcyclist deaths by state, 2024
Riders and passengers killed, ranked by total; rate per 100,000 residents
| # | State | Deaths | Per 100K |
|---|---|---|---|
| 1 | Florida | 642 | 2.75 |
| 2 | Texas | 583 | 1.86 |
| 3 | California | 522 | 1.32 |
| 4 | Ohio | 222 | 1.87 |
| 5 | Arizona | 219 | 2.89 |
| 6 | Pennsylvania | 217 | 1.66 |
| 7 | North Carolina | 212 | 1.92 |
| 8 | New York | 209 | 1.05 |
| 9 | Tennessee | 188 | 2.60 |
| 10 | Michigan | 184 | 1.81 |
| 11 | Georgia | 182 | 1.63 |
| 12 | Colorado | 165 | 2.77 |
| 13 | South Carolina | 154 | 2.81 |
| 14 | Illinois | 150 | 1.18 |
| 15 | Missouri | 145 | 2.32 |
| 16 | Indiana | 137 | 1.98 |
| 17 | Alabama | 127 | 2.46 |
| 18 | Virginia | 122 | 1.38 |
| 19 | Kentucky | 118 | 2.57 |
| 20 | Washington | 113 | 1.42 |
| 21 | New Jersey | 112 | 1.18 |
| 22 | Wisconsin | 106 | 1.78 |
| 22 | Oklahoma | 106 | 2.59 |
| 24 | Maryland | 95 | 1.52 |
| 25 | Nevada | 89 | 2.72 |
| 26 | Oregon | 85 | 1.99 |
| 27 | Arkansas | 76 | 2.46 |
| 28 | Connecticut | 75 | 2.04 |
| 28 | Minnesota | 75 | 1.29 |
| 30 | Massachusetts | 70 | 0.98 |
| 30 | Louisiana | 70 | 1.52 |
| 32 | Iowa | 63 | 1.94 |
| 33 | Kansas | 56 | 1.89 |
| 34 | Mississippi | 55 | 1.87 |
| 35 | Utah | 53 | 1.51 |
| 36 | New Mexico | 50 | 2.35 |
| 37 | Idaho | 47 | 2.35 |
| 38 | West Virginia | 38 | 2.15 |
| 38 | Montana | 38 | 3.34 |
| 40 | New Hampshire | 35 | 2.48 |
| 40 | Maine | 35 | 2.49 |
| 42 | South Dakota | 33 | 3.57 |
| 43 | Nebraska | 32 | 1.60 |
| 44 | Hawaii | 26 | 1.80 |
| 45 | Wyoming | 24 | 4.08 |
| 46 | Delaware | 22 | 2.09 |
| 47 | North Dakota | 17 | 2.13 |
| 48 | Alaska | 10 | 1.35 |
| 49 | District of Columbia | 9 | 1.28 |
| 50 | Rhode Island | 8 | 0.72 |
| 51 | Vermont | 7 | 1.08 |
What riders control
The findings also add up to a checklist of things within your control:
- Get the endorsement before you ride in traffic. A third of operators in fatal crashes lacked a valid motorcycle license. The permit test and rider course exist precisely because riding a car does not transfer.
- Wear a DOT-compliant helmet in every state. The 11-percent-versus-48-percent gap between universal-law and non-universal-law states shows what the law does to behavior. The law does not have to do it to you. Look for the FMVSS 218 DOT marking.
- Treat night rides as a different discipline. Impairment among killed riders more than doubles after dark, which means the traffic around you changes too. Sober riding is the baseline; extra following distance and visibility gear are the adjustment.
- If you are shopping for a bike, prefer ABS. The 22-percent reduction in fatal crashes associated with antilock brakes is the closest thing to an airbag a motorcycle currently offers, and about a third of new bikes still ship without it.
- Check your state’s rate per 100,000 residents before you trust the raw count. Vermont’s seven deaths mostly reflect how small the state is, and say little about per-mile risk.
Riders have not shared the safety gains cars keep making. Until motorcycle crash protection enters federal rulemaking, the gap keeps its shape, and the decisions that close it for an individual rider remain the same ones the data has been pointing at since 1975: licensing, helmets, sobriety, and visibility.
Sources and notes
- NHTSA, “Traffic Safety Facts 2024 Data: Motorcycles,” DOT HS 813 824 (2026). All national 2024 figures: deaths, injuries, rates, licensing, alcohol, and helmet findings.
- NHTSA, “Overview of Motor Vehicle Traffic Crashes in 2024,” DOT HS 813 791 (2026). Total fatalities of 39,254 and the 4.3% decline.
- NHTSA Motorcycle Safety page and its May 2025 release of 2023 fatality rates (31.39 per 100M VMT for riders, 1.13 for car occupants).
- National Safety Council, Injury Facts motorcycle data: 2024 state death counts and the registration share (motorcycles, ~3% of registered vehicles).
- injured.org, “Motorcycle Deaths by State” (FARS 2000 to 2024): per-capita rates and full-state records.
- IIHS, Fatality Facts 2024: Motorcycles and ATVs: the 1975 to 2024 trend table, helmet effectiveness figures, universal-law state count, and the 23% rise since 2019.
- NHTSA 2019 state table (2018 and 2019 figures for Florida, Texas, and California); 2023 state figures from FARS as reported in local coverage of IIHS/FARS data.
- Marc L. Shapiro, P.A. press release via ACCESS Newswire (August 2026) for the Florida analysis quote. Figures in that analysis trace to the NSC/FARS dataset.
- The 2024 FARS file is the Annual Report File. NHTSA notes it can change slightly when the final file is published with the 2025 annual report. Injury counts are national estimates from NHTSA’s crash sample, not exact tallies.

Permit.Bike is singularly devoted to the purpose of providing an easy-to-learn and simple approach to the act of riding.